Reports
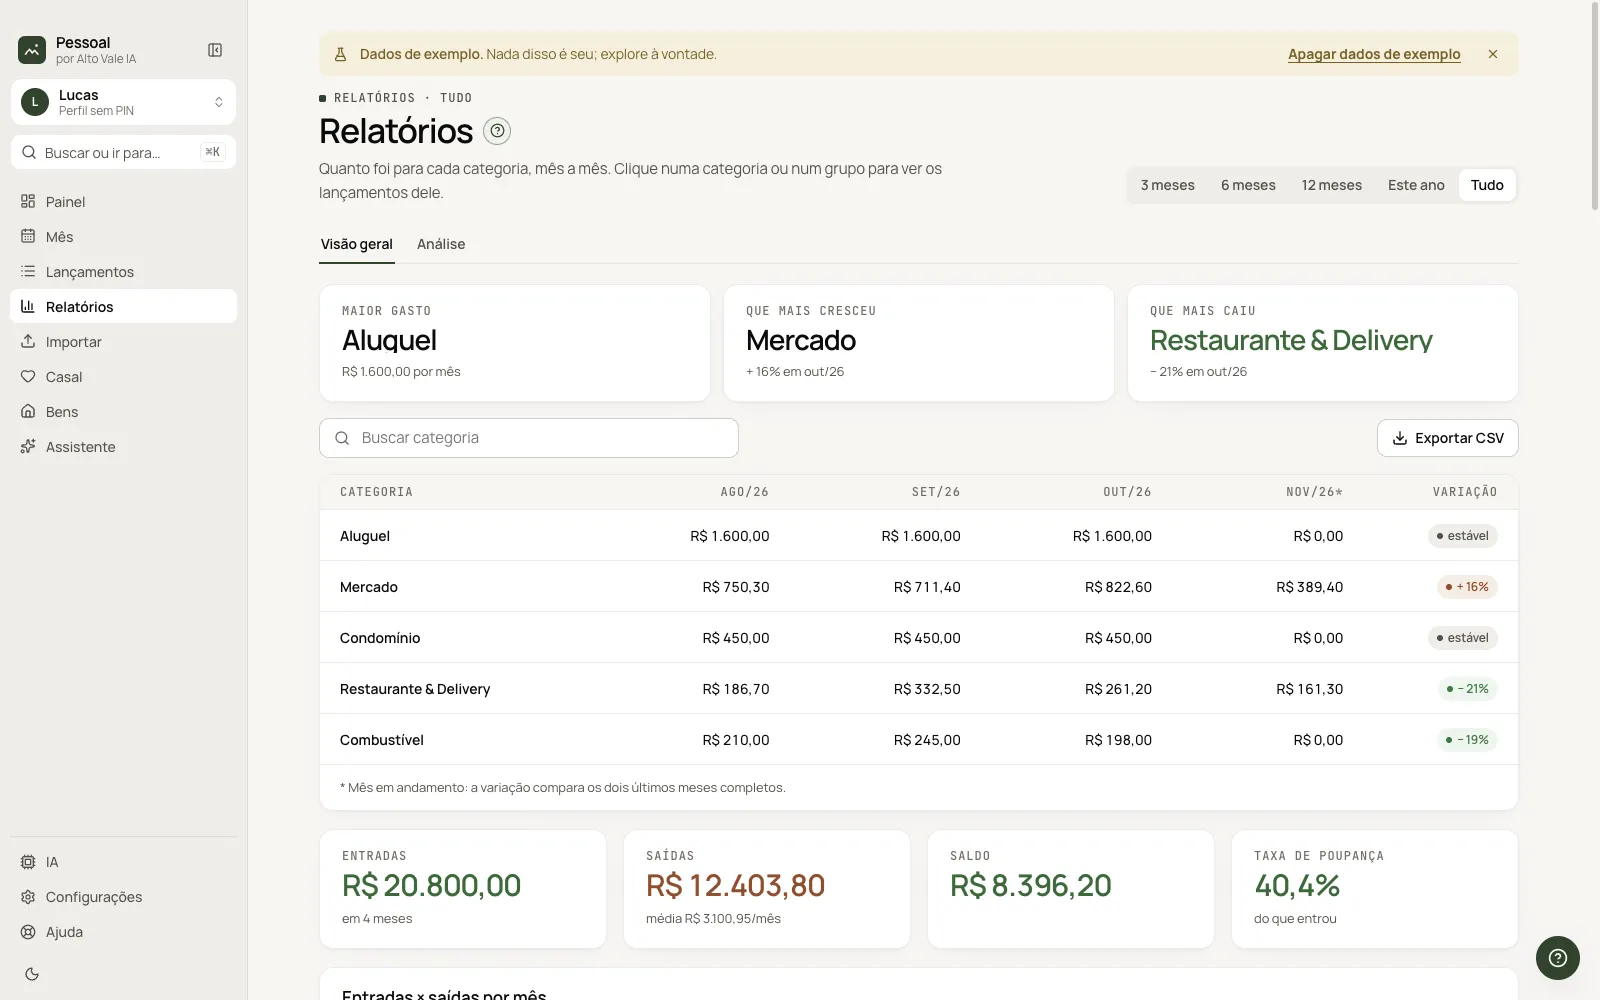
How much went to each category, month by month, with period charts and CSV export.
What it is for
Shows the whole period in numbers and charts. Clicking a category or group opens its entries.
Before you start
- Have months logged in the period.
Step by step
- Pick the period: 3 months, 6 months, 12 months, This year or All.
- Read Biggest expense, Grew the most and Fell the most.
- Search a category in the category × month table.
- Scroll to the charts.
Every action on this screen
Biggest, grew and fell
Example: Rent (R$ 1,600/mo), Groceries +16%, Restaurants −34%.
Category × month table
Latest months side by side, with change; the month in progress is marked *.
Export CSV
Creates the table as CSV (";" separator, decimal comma).
Charts
Income × expenses, balance, spending by group, top categories, trend, fixed × variable, weekday, net worth and largest expenses; click to open entries.
Analysis tab
Leads to the Analysis guide.
Shortcuts
- ⌘K: another screen.
Common problems
The table is empty. There are no months in the period: choose All.
See also
Screen in the app: /relatorios · In the app, press F1 on this screen to open this guide.
Still have a question?
Talk to the Alto Vale IA team on WhatsApp. Tell us the app, the screen and what happened.